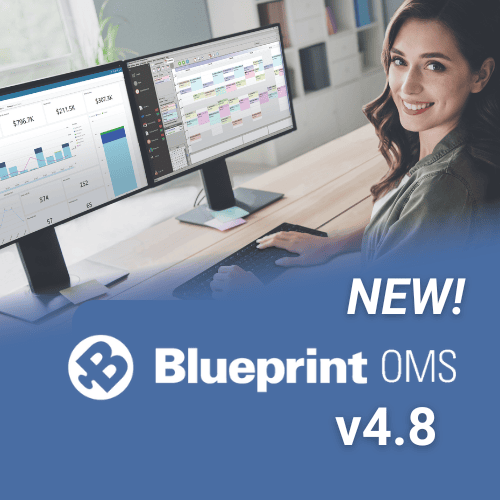
Your new dashboard is ready!
OVERVIEW
From a bird’s eye view, right down to the details of individual transactions, our new dashboard will give you instant insight into your business.
Interactive data filtering, decomposition, and drillthrough will allow you to find the answers to many of your most detailed (and revealing) questions, all in one place.
We’ve added some new widgets, and retired some of the older ones. We’ve also moved the Location performance and Provider performance widgets onto separate tabs.

FEATURE HIGHLIGHTS
Interactive filtering
By default, the dashboard shows all data for the current year. However, it is very easy to change the date range or filter the data using the interactive filters at the top of the dashboard.

For example, clicking the Date range selector will open the following panel on the right side of the screen.

The other filters allow restricting the data to include only selected:
- Locations
- Providers
- Manufacturers

Here are a few examples of interesting questions which can be answered using just data filtering:
- How much did location A contribute to total revenue?
- How much did provider A contribute to gross profit?
- What is the return rate for provider A? for Manufacturer B?
- What was our no-show rate last December?
Interactive decompose

Tip: Before decomposing, click the “maximize” (also called “slideshow”) button. The small KPI widgets aren’t large enough to show the decomposed data.
This is done by clicking the interaction button beside the widget title.

For example, decomposing the ASP by Location would yield the data below.

You can select one of the other visualization options for a different view:

You can also click on an individual piece of the data and decompose it further. For example, clicking on the bar for Cardiff and decomposing by Manufacturer would show the data below.

Clicking the Initial “breadcrumb” above the decomposed data will return to the original KPI (a single number).
Here are a few examples of interesting questions which can be answered using the Decompose function:
- How much did each location contribute to total revenue?
- How much did each provider contribute to total revenue?
- How does our return rate vary by provider? By manufacturer?
- How has the ASP for provider X changed over the last 6 months?
- How does our no-show rate vary by location?
Interactive drillthrough
Drillthrough allows you to see the individual items that underlie an aggregated statistic. You can do this by clicking on a number in a grid, or elements of a chart such as a slice (pie chart), or a bar (bar chart).

The example above shows how to drillthrough on the Net units number for theBrighton location to see details of the individual unit sales, yielding the data below.

The results can be easily exported to CSV or Excel format.
User-specific data view
The dashboards can restrict data access based on the identity of the user who is logged in. This means that a single dashboard can show different data to different people.
For example, User A could be restricted to viewing data only for location B. This could also be extended to a whole group of users by having them share a single login for the dashboard portal.
Another alternative is to have separate dashboards for restricted users, which are static and do not allow interaction (e.g. filtering, decomposition, drillthrough). Static dashboards can be shared with URL links, and do not require users to login to view them. If interaction is not required, this can be a cost-effective alternative (see the Notes on pricing section below).
Please contact us if you would like to set up user-specific (or group-specific) data access.
Automated delivery
Want to receive the dashboard automatically in your Inbox?
Automated delivery can be scheduled daily, weekly, or monthly, in PDF, image, Excel, or CSV format.
Please contact us if you would like to receive automated emails with your dashboard.

Easy export

Click the download button to export the content of any widget, in image, PDF, CSV, or Excel format.
Notes on pricing
Pricing on the new dashboard platform is based on the number of user logins required,not the number of dashboards.
- 1 username: $14/month
- 2 usernames: $24/month
- Additional usernames: $7/month each
There is no additional monthly cost for having additional dashboards.
What’s next?
Your ideas and suggestions have been behind many of the improvements to the KPI dashboard. Thank you!
We’re looking forward to your comments and suggestions, and adding new widgets to make the dashboards one of your most essential and valuable tools.
Related Articles
Convert community leads into patients with the MedRx Kiosk

MedRx Kiosk self-screening and lead generation has a direct data feed into your Blueprint OMS. Automatically receive patient...
Read MoreNew Features and Enhancements in v4.8

In this article: New Features: 1. Interactive Patient Texting (SMS) 2. Integration with Heidi Health 3. Voice-to-text Dictation...
Read MoreNEW Marketing Templates Available from Oticon!

We have collaborated with Oticon to bring you two new email marketing templates for Better Hearing Month and...
Read More