Instant business insight — Blueprint OMS Dashboard
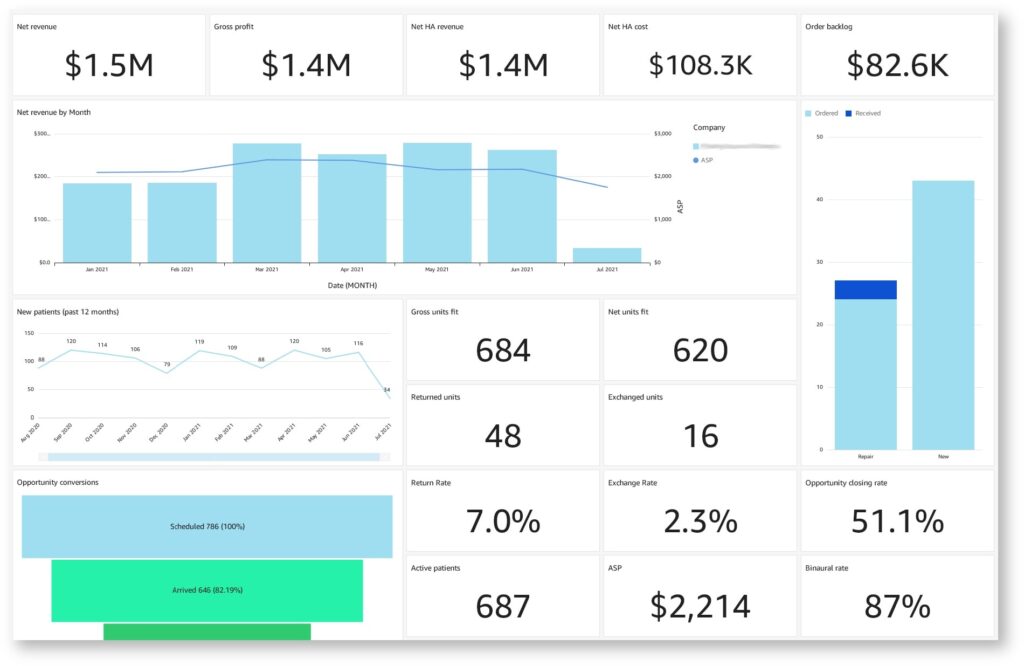
From a bird’s eye view to detailed breakdowns, the Blueprint OMS dashboard will give you instant insight into your practice’s performance.
Interactive data filtering and visuals will provide the answers to your most detailed (and revealing!) questions, all in one place. See all of your key performance indicators (KPIs) at a glance including financials, sales, closing rates, and much more.
Feature Highlights
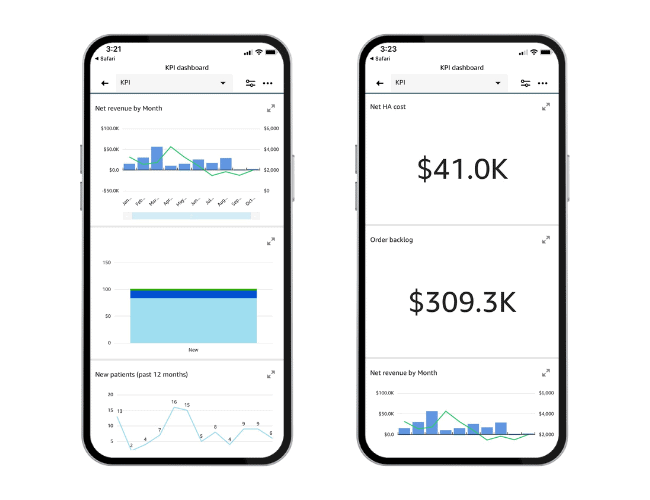
Dashboard Access
The dashboard can be accessed from your iPhone, iPad, or smartphone.
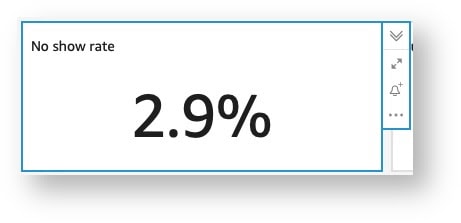
Widget Display
Each KPI is represented by an easy-to-understand widget.
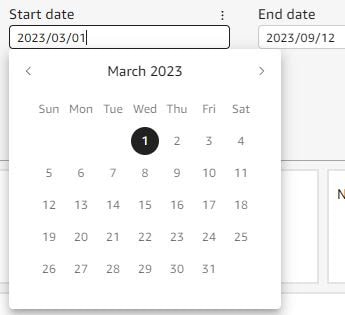
Interactive Filtering
By default, the dashboard shows all data for the current year. However, it is very easy to change the date range or filter the data using the interactive filters at the top of the dashboard.
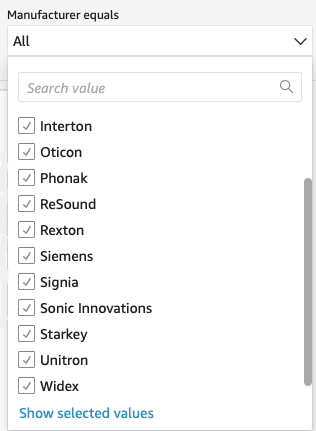
The other filters allow restricting the data to include only selected:
- Locations
- Providers
- Manufacturers

Here are a few examples of interesting questions that can be answered using just data filtering:
- How much did location A contribute to total revenue?
- How much did provider A contribute to gross profit?
- What is the return rate for provider A? For manufacturer B?
- What was our no-show rate last December?
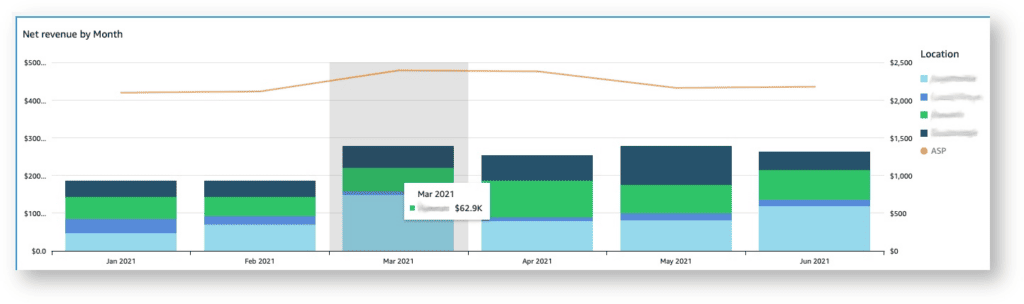
Interactive Filtering
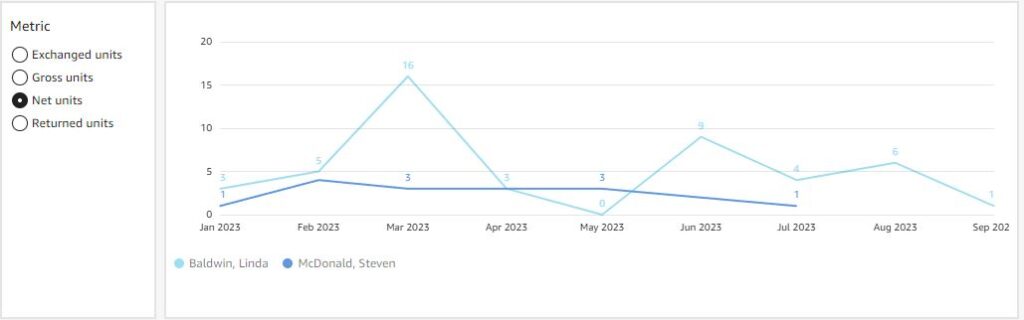
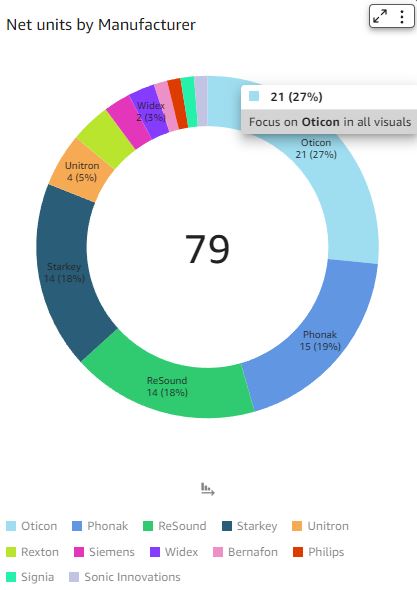
The Analysis tab at the top provides widgets that can display a metric of interest such as gross, net, exchanged, or returned units grouped by location, provider, or manufacturer.
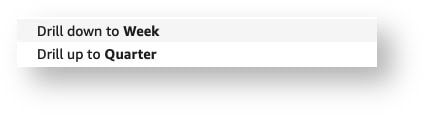
Changing the timescale resolution
For widgets showing the timescale on the X-axis, the resolution can be increased or decreased using the Drill down and Drill up options that appear when a data point is clicked.
User-specific data view
The dashboards can restrict data access based on the identity of the user who is logged in. This means that a single dashboard can show different data to different people.
For example, User A could be restricted to viewing data only for location B. This could also be extended to a whole group of users by having them share a single login for the dashboard portal.
Please contact us if you would like to set up user-specific (or group-specific) data access.
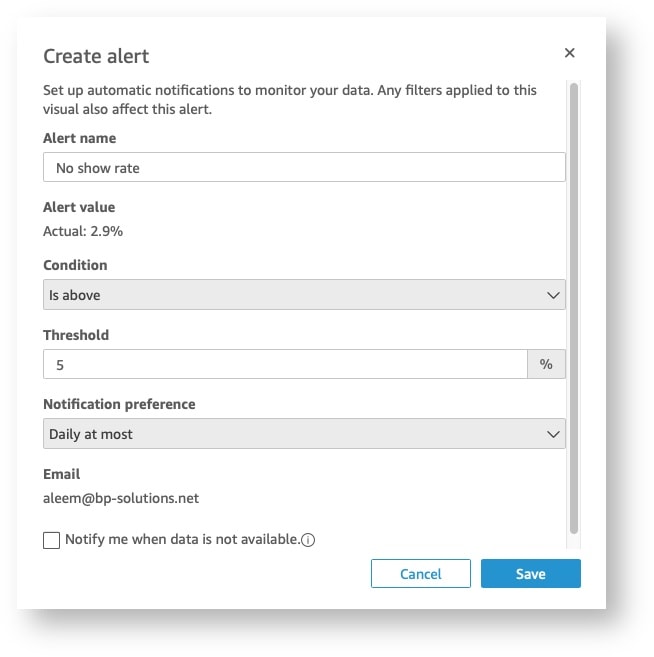
Creating automatic alerts
Dashboards can send automated alerts by email when a metric reaches a particular threshold. To set up an automatic alert for a metric, select the widget and then click the Add alert (bell) button.
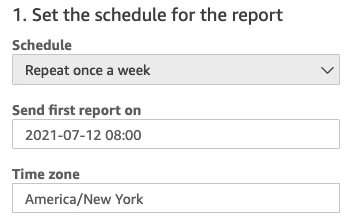
Automated Delivery
Want to receive the dashboard automatically in your inbox?
Automated delivery can be scheduled daily, weekly, or monthly. The email will include an image of the dashboard as well as an attached PDF version.
Please contact us if you would like to receive automated emails with your dashboard.
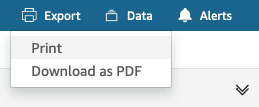
Easy Export
Click the Export button to print the dashboard or export a PDF version.
Pricing
Pricing on the dashboard platform is based on the number of user logins required.
- 1 username: $14/mo
- 2 usernames: $24/mo
- Each additional username: $7/mo
Users can share a dashboard login if no data access restrictions are required for those users.
Help and Resources
You can find a detailed reference guide to the dashboard here.
Should you need any help with the dashboard, don’t hesitate to get in touch.
We look forward to hearing from you!


No comments